

What makes a good debugging skill
Debugging is mostly a search problem: narrowing a large space of possible causes down to the one that's actually responsible, as fast as possible. A good debugging skill either hands an agent a tool it wouldn't otherwise know how to drive well (a trace CLI, a log format, an observability platform's query syntax) or it encodes a methodology that took someone real trial and error to work out, like tracing a stack from the crash site backward to the actual producer of bad data instead of patching the site where the crash happened.
The tell for a weak debugging skill is genericness: "helps debug your code" says nothing an agent doesn't already do by default. The skills below all commit to something specific (a named tool, a named log format, a named failure mode) which is exactly what makes them worth installing over relying on general reasoning alone.
One thing to check before installing any of them: several bundle scripts that need Python, Node.js, or shell access to actually run. An agent without tool execution enabled will load the instructions fine and then stall at the first step that tries to run something.
How this list is ordered
Most broadly useful first. Playwright Trace CLI and Runtime Behavior Probe lead because they apply to almost any JavaScript/TypeScript test suite and almost any codebase respectively. Neither assumes a specific company's internal tooling. From there the list moves through skills for a specific but sizeable audience (LLM application debugging via Phoenix or Arize, PyTorch issue triage) toward skills scoped to one team's internal systems (VS Code's own contributor tooling, a specific low-code platform's flow debugger). Stars and repo activity are a secondary signal, used to break ties within a tier, not the primary ranking factor.
| Skill | Best for | Requires |
|---|---|---|
| Playwright Trace CLI | Inspecting Playwright test traces from the terminal | Node.js, shell |
| Runtime Behavior Probe | Investigating real runtime behavior beyond code review | Python |
| Error Fixing Guidelines | Root-causing telemetry-reported errors properly | Nothing extra |
| Phoenix CLI | Debugging LLM apps instrumented with Phoenix | Shell |
| Arize Trace | Debugging LLM apps instrumented with Arize | Shell |
| Fix PyTorch GitHub Issue | Reproducing and fixing a single PyTorch bug report | Shell |
| Power Automate Debugging | Root-causing failed Power Automate flows | Nothing extra |
| Code OSS Dev - Launch + Debug | Debugging VS Code itself from source | Node.js, shell |
| Agent Host Debug Logs | Analyzing VS Code Agent Host log exports | Python, shell |
The nine skills
Playwright Trace CLI
Maintained inside Microsoft's core microsoft/playwright repository (94,000 stars), this lets an agent inspect a .zip trace file (actions, network requests, console output, errors, snapshots and screenshots) entirely from the terminal, without launching a browser. It's a genuine time-saver for CI debugging, where a failing test's trace file is often the only evidence you get.
Who it's for: any team running Playwright end-to-end tests that wants trace inspection to work in an agent session or a headless CI environment. Requires Node.js and shell access. The skill's own caveat: it's the wrong choice if you prefer a GUI for inspecting results, or if your project doesn't use Playwright at all. Apache-2.0 licensed.
Runtime Behavior Probe
From OpenAI's openai-agents-python repository (29,000 stars), this is a methodology skill more than a tool wrapper: it plans and runs temporary probe scripts, validation matrices and state controls to verify actual runtime behavior, then reports findings first. It's explicitly meant for going past a happy-path smoke check to surface edge cases and undocumented behavior in local or live integrations.
Who it's for: anyone debugging an integration where code review alone won't reveal what's actually happening at runtime. Requires Python. Caveat, direct from the skill: skip it for simple code checks, or when you don't actually need to investigate past documented behavior. It's built for genuine uncertainty, not routine verification. MIT licensed.
Error Fixing Guidelines
Part of microsoft/vscode (189,000 stars), this documents a specific and genuinely transferable discipline: when investigating an unhandled error, trace the data flow through the call stack from bottom to top to find where invalid data actually originated, rather than patching the symptom at the crash site. It's written against VS Code's own error-telemetry dashboard, but the underlying method (producer versus consumer, don't silently swallow errors) applies well beyond VS Code specifically.
Who it's for: teams that want a worked example of disciplined root-causing to adapt, or VS Code contributors triaging the telemetry dashboard directly. No runtime requirements. Caveat: the skill's guidance is written around telemetry-reported errors specifically, and it says plainly it's not for developers looking for a quick, superficial fix. MIT licensed.
Phoenix CLI
An awesome-copilot skill (38,000 stars) for debugging LLM applications through the Phoenix observability platform, fetching traces, analyzing errors, structuring review with open and axial coding, inspecting datasets, reviewing experiments, and querying Phoenix's GraphQL API.
Who it's for: teams that have already instrumented their LLM application with Phoenix and want an agent that can query it directly instead of switching to a dashboard. Requires shell access. Caveat: it assumes Phoenix specifically. It won't help if you're on a different observability stack, and it's not built for users who want a GUI. MIT licensed.
Arize Trace
The Arize equivalent of the skill above, also from awesome-copilot: downloading, exporting and inspecting existing traces and spans through Arize's ax CLI, covering trace-by-ID, span-by-ID and session-by-ID exports plus root-cause investigation for behavior regressions.
Who it's for: teams on Arize specifically rather than Phoenix. Requires shell access. Caveat: scoped to inspecting existing trace data. It's not general-purpose data analysis, and offers nothing beyond exporting traces and spans if that's not what you need. MIT licensed.
Fix PyTorch GitHub Issue
Maintained in the pytorch/pytorch repository itself (102,000 stars), this automates the reproduce-root cause-fix cycle for bugs reported in PyTorch's GitHub issue tracker, coordinating a team of subagents to keep the process methodical rather than jumping straight to a patch.
Who it's for: contributors fixing concrete PyTorch bugs from an issue number or URL. Requires shell access. Caveat, stated directly: not for feature requests, support questions, or anything that isn't a single, concrete, reproducible bug. BSD-2-Clause licensed. Worth studying even outside PyTorch, as a template for how a reproduce-then-fix workflow should be structured.
Power Automate Debugging
An awesome-copilot skill for a genuinely underserved debugging problem: Power Automate's Graph API only exposes top-level status codes for a failed cloud flow, which is rarely enough to find a root cause. This skill uses the FlowStudio MCP server to pull action-level inputs and outputs instead, so an agent can actually see where a flow broke.
Who it's for: teams building on Power Automate who need more than a generic "the flow failed" message. No bundled-script requirement beyond having FlowStudio MCP configured. Caveat: it needs a valid FlowStudio MCP subscription, and it's not a general-purpose debugger for anything outside Power Automate. MIT licensed.
Code OSS Dev - Launch + Debug
Also from microsoft/vscode, this launches Code OSS (VS Code built from source) into an isolated, throwaway profile with unique debug ports, so an agent can drive the workbench with @playwright/cli and attach a Node debugger via dap-cli in the same session. It's a serious piece of tooling for anyone actually working on VS Code's codebase.
Who it's for: VS Code contributors debugging the renderer, extension host, or main process while also automating UI interaction. Requires Node.js and shell access. Caveat: genuinely not useful outside VS Code development. It needs isolated debugging environments most projects have no reason to set up. MIT licensed.
Agent Host Debug Logs
The narrowest entry on this list: analyzes debug log exports from VS Code's Agent Host environment specifically, ah-logs/ahp-logs bundles, events.jsonl, AHP JSONL transport logs, Agent Host.log, copilot-logs. Because these bundles can contain tokens and user prompts, the skill is written to handle extraction and analysis with that sensitivity in mind.
Who it's for: developers troubleshooting the VS Code Agent Host specifically. Requires Python and shell access. Caveat, stated directly: not suitable for general log analysis outside the Agent Host context. MIT licensed.
How to install these skills
All nine install the same way, as a SKILL.md folder placed in an agent's skills directory. The skills CLI handles this in one command:
npx skills add microsoft/playwright/playwright-trace --agent claude-code
npx skills add openai/openai-agents-python/runtime-behavior-probe --agent claude-code
Swap in any skill's install coordinate, each one's page on getclaudeskills.com/skills lists the exact owner/repo/skill-path to use. Debugging skills tend to be worth installing at personal scope rather than project scope, since they're usually about how you investigate rather than a convention the whole team needs to share, though a skill like Error Fixing Guidelines, tied to a specific telemetry dashboard, makes more sense checked into the project it applies to.
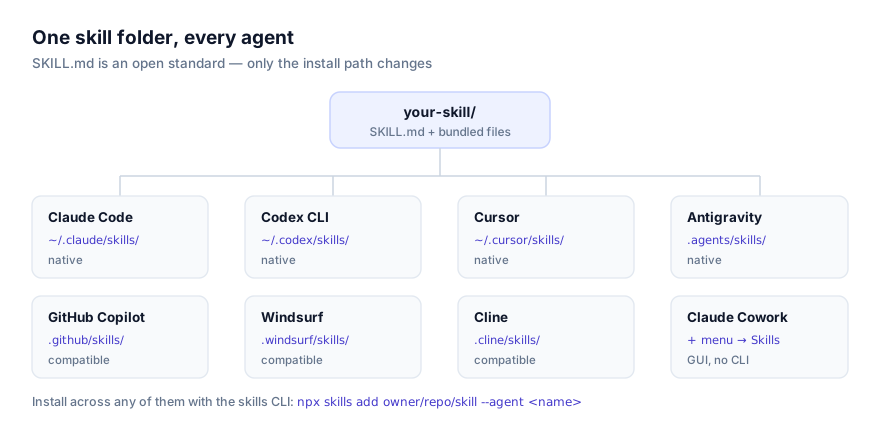
Full walkthroughs, including manual install without the CLI: how to install skills in Claude Code and how to install skills in Codex CLI.
Combining debugging skills without confusing your agent
A few of these are designed to sit next to each other without conflict, Playwright Trace CLI and Fix PyTorch GitHub Issue, for instance, address completely different failure surfaces and will never both match the same request. Where it gets murkier is installing both Phoenix CLI and Arize Trace at once if you've only instrumented one of the two platforms: an agent has no way to know your Phoenix setup doesn't exist, and a description match doesn't guarantee the underlying tool is actually configured. Install the one that matches your actual observability stack, not both defensively.
More generally, debugging skills tend to activate on fairly specific trigger phrases ("investigate the trace," "symbolicate the crash," "root-cause this flow") so overlap between two installed skills is less common here than in categories with vaguer descriptions. How agents discover and activate skills covers the underlying matching mechanism if you want to understand why a particular phrasing did or didn't trigger the one you expected.
Why isn't my skill activating?
The most frequent cause is a missing runtime. Five of the nine skills here need Python, Node.js, or shell access to run a bundled script, if you're working in a sandboxed or browser-only agent session without tool execution, the skill's instructions will load, but the step that actually runs the CLI or script will fail. Confirm your agent's execution permissions before assuming a skill is broken.
The second cause is a tool that isn't actually configured. Phoenix CLI and Arize Trace both assume the underlying platform is already instrumented in your project. The skill can't create that instrumentation for you, only operate on data that already exists. If a trace-inspection skill seems to do nothing, check whether there's anything for it to inspect yet.
The third, specific to the VS Code-sourced skills here (Error Fixing Guidelines, Code OSS Dev - Launch + Debug, Agent Host Debug Logs): they assume VS Code's project structure and internal tooling. Installing one in an unrelated codebase and expecting it to activate on a generic "help me debug this" request usually won't work, because its description is scoped narrowly on purpose.
Where to go next
The full debugging and testing category, including the three skills not covered in this list, is at getclaudeskills.com/categories/development/debugging. For adjacent ground, see the best code review skills and the best DevOps skills. Browse everything at getclaudeskills.com/skills, and if your team has a debugging workflow specific enough that nothing here fits, how to write your own agent skill covers building one from scratch.